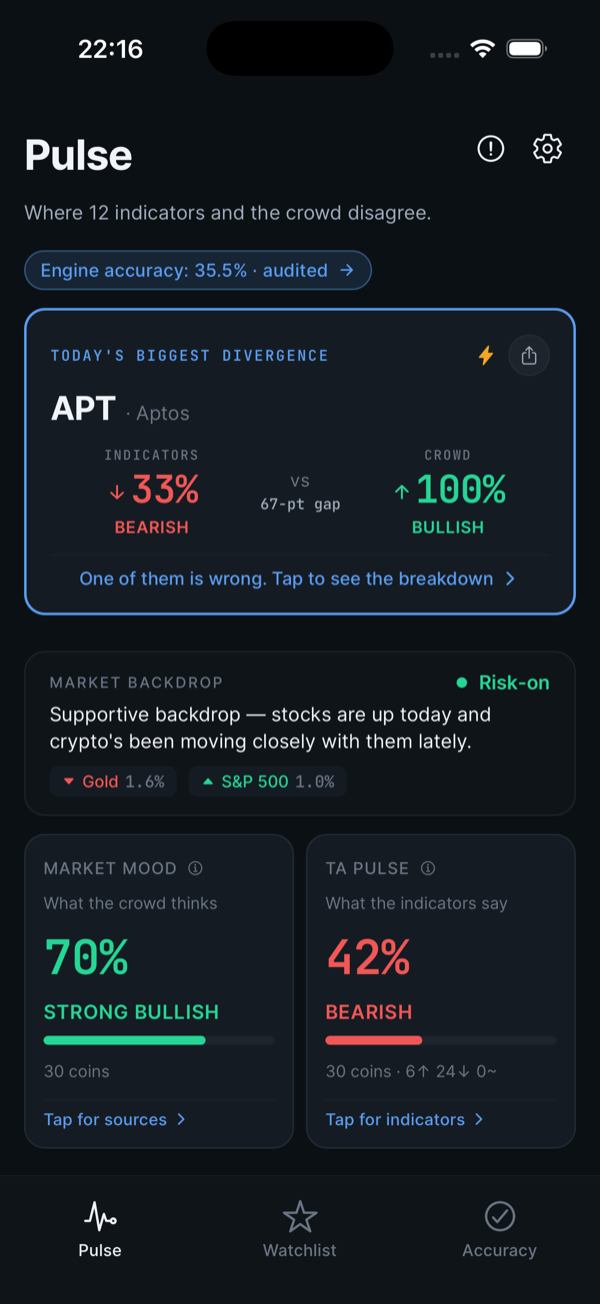
We publish our own 35.5% accuracy

When the crowd and the chart disagree.

NEW · Bullshit Detector NEW · Daily Brief NEW · Portfolio

Cryptochartics tracks what 12 indicators say AND what the crowd is feeling — and tells you when they pull in opposite directions. Not a buy call. Not a prediction. The disagreement is the signal.

We measured our own engine's accuracy honestly. 35.5% win rate. We published the full audit. Read it →

30+ coins · CoinGecko + Wikipedia sentiment Free tier — no credit card Published track record
Live preview refreshing…
BTC Bitcoin 4h
Bullish 9/12 75% agreement
9 bull 1 bear 2 neutral
4h · refreshes hourly
ETH Ethereum 4h
Mixed 6/12 50% agreement
6 bull 4 bear 2 neutral
4h · refreshes hourly
SOL Solana 4h
Bearish 8/12 67% agreement
0 bull 8 bear 4 neutral
4h · refreshes hourly
What shipped in v1.3

Built for crypto skeptics.

Four features for the people who roll their eyes at every "$X by EOY" tweet. Call bullshit on predictions. Close the loop on yesterday's calls. Make every alert about coins you actually own. And lock in a price that never renews.

Daily Pulse Brief

One card at the top of your morning. Today's market mood vs. yesterday. Today's biggest engine-vs-crowd gap. Yesterday's strong divergences resolved — who was right, the engine or the crowd? The ritual that closes the loop.

Mood Δ vs yday +8 pts
Biggest gap today SOL · 52-pt diverge
Yesterday's calls Crowd 2 · Engine 1
Brief for May 30 Once / day

Portfolio · Connect Binance

Read-only API key. We pull your holdings, then prioritize alerts and divergences for coins you actually own. Skip the noise on coins you don't hold. Make every alert personal.

Connected Binance · read-only
Tracking BTC · ETH · SOL · LINK
Alert priority Your bag first
Permissions ✓ Read-only

Lifetime — $299, never renews

One-time payment. All Max features. Lifetime updates. Direct line to the founder. Founder's price, first 100 buyers only. The honest alternative to a subscription you'll forget to cancel.

Price $299 · one-time
Renewal Never
Includes All Max + founder access
Scarcity First 100 only
How it works

Two signals. One conversation.

We compute what 12 indicators say AND what the crowd is feeling — and surface the moments they disagree. The disagreement is the signal. Every input is auditable. No black box, no profit promise.

01 · What the chart says

12 technical indicators, hourly, per coin.

RSI, MACD, EMA cross, Stochastic, Bollinger Bands, ATR, ADX, OBV, Ichimoku, CCI, Williams %R, Volume Profile — all configured to widely-published defaults. Each casts a bull / bear / neutral vote. The consensus direction is published, every vote is auditable.

RSIMACDEMA×Stoch BBATRADXOBV IchimokuCCIW %RVolume
02 · What the crowd thinks

Hourly sentiment from CoinGecko + Wikipedia.

Community engagement scores from CoinGecko (votes, watchlist activity, exchange listings) and interest spikes from Wikipedia pageviews. Aggregated into one 0–100 bullish % per coin. No scraped Twitter. No astrology. Refreshes every hour.

Bullish %
28% bullish 72% bearish
03 · Where they disagree

The gap is the signal.

When the engine says BULLISH but the crowd is 28% bullish (a 50+ point gap), we flag it as a strong divergence. Push notifications fire on these moments — not on every directional reading. We don't claim divergence predicts price. We claim it's worth a second look.

⚠ Diverges · 52-pt gap
Engine bullish on SOL · crowd 28% bullish.
Flagship — Pulse, v1.1.0

The chart, the crowd. And the gap.

Most apps show you indicators on one screen and chat hype on another. Cryptochartics puts them side by side — and flags the moments they pull apart. Strong divergences fire a push alert; aligned readings stay quiet. The interesting trade is the one where the two stories don't match.

Why we built this

Most crypto apps show you indicators in one tab and chat hype in another. The gap between those two screens is where the interesting questions live — and where most users miss the story.

Cryptochartics puts them side by side. When the technical consensus and the crowd point the same way, it's a clean read. When they strongly disagree — a 35+ point gap on our bullish-% scale — we flag it as a divergence and fire a push.

We're not claiming divergences predict price. We're claiming they're information worth pausing on, for any decision you're going to make anyway.

Sentiment refreshes hourly, sourced from CoinGecko community signals + Wikipedia interest spikes. No scraped Twitter, no astrology.

SOL · 4h

Live consensus

refreshed 18s ago
12 indicators
9 of 12
leaning bullish
Crowd sentiment
28%
bullish · bearish lean
Divergence intensity
⚠ Strong divergence · 52-pt gap

Engine bullish, crowd bearish. We don't tell you what to do — we tell you to look closer before you decide.

The technical layer

What the chart says — in 12 readings.

The technical half of the crowd-vs-chart comparison. No proprietary "AI score". Every formula is published, every threshold is the textbook default, every vote is auditable. The audit shows some of these are noisy or even reverse-predictive — we publish that too, on the audit.

RSI
Relative Strength (14)
Overbought / oversold momentum oscillator. Threshold 70 / 30.
Bullish
MACD
Moving Avg Convergence (12,26,9)
Trend-following momentum from the difference of two EMAs.
Bullish
EMA×
EMA Cross (50/200)
Death cross / golden cross. The macro trend signal everyone watches.
Bullish
Stoch
Stochastic (14,3,3)
Closing price relative to its range over the last N periods.
Neutral
BB
Bollinger Bands (20, 2σ)
Standard-deviation bands around a 20-period moving average.
Bullish
ATR
Average True Range (14)
Volatility — direction-agnostic. Used to size confidence.
Neutral
ADX
Directional Index (14)
Strength of the prevailing trend, regardless of direction.
Bullish
OBV
On-Balance Volume
Cumulative volume flow — confirms or contradicts a price move.
Bullish
Ichimoku
Cloud (9, 26, 52)
Multi-line trend system. Cloud above price = bullish bias, below = bearish.
Bullish
CCI
Commodity Channel Index (20)
Deviation from a typical price across the lookback window.
Bullish
W %R
Williams %R (14)
Faster Stochastic variant. The audit found this one reverse-predictive — when it disagrees with the rest, the signal wins 60% of the time.
Disagrees
Volume
Volume Profile
Where volume actually transacted — support and resistance from real trades.
Bullish
vs. the alternatives

The only crypto app honest about its own accuracy.

We respect what TradingView, LunarCrush, and the various signal services do well. But for "how does the chart's read stack up against what the crowd is feeling, and how often is the engine actually right?" — Cryptochartics is the only tool that puts both signals together AND publishes its measured win rate openly.

Feature Cryptochartics TradingView LunarCrush Signal services Telegram groups
Crowd sentiment + 12-indicator TA side-by-side~
Push alerts on engine-vs-crowd divergence
Bullshit Detector — check any influencer prediction
Daily Pulse Brief — yesterday's resolution recap
Portfolio integration (Binance read-only)
Lifetime tier — one payment, no renewal
Engine win rate published openly
Indicator-by-indicator transparency
Plain-English explanations per vote
Mobile-first design~~
No "guaranteed profit" claims
Free tier
Annual price (top tier)$99$599+$240+$500–2k+varies
Pricing

Pay annually. No surprises.

Pay once a year in USDT (TRC20, Polygon, BEP20), or monthly through your app store. No auto-renewal on the annual plan. No card-on-file trap. When the year is up, you decide whether to renew. Or stay free, forever.

Free

$0 / forever
no card, no signup
  • 2 coins on watchlist
  • 4-hour and 1-day timeframes
  • Pulse — crowd sentiment per coin
  • 12-indicator technical readings
  • Crowd-vs-engine divergence chip on every signal
  • Bullshit Detector (5 checks / day)
  • Daily Pulse Brief
  • Engine Accuracy report (honest win rate)
  • No divergence push notifications
  • No portfolio / Binance connect
Get the app

Max

$99 / yr
or $12 / month via app store
  • Unlimited coins
  • All 7 timeframes including 5m and 1M
  • Custom divergence thresholds per coin
  • Inspect Mode — drill into every trade behind any number
  • Per-source sentiment breakdown (CoinGecko + Wikipedia)
  • Full 12-indicator audit history per coin
  • All Pro-tier benefits included

Start 7-day free trial · no card needed

Go Max
Founder's price

Lifetime

$299 / one-time
first 100 buyers · never renews
  • All Max features, forever
  • Lifetime updates — every future feature included
  • Direct line to Murat (founder · WhatsApp / email)
  • Founder's Circle — private Discord with the audit data
  • No renewal, no card-on-file, no expiry
  • One-time USDT payment (TRC20 / Polygon / BEP20)
Lock in Lifetime → $299
Questions

The fine print, up front.

What's the Bullshit Detector?
A 3-second sanity check on any crypto prediction. You enter the coin, the direction (UP / DOWN), the target price, and the timeframe — the app runs that claim against the live 12-indicator engine read AND the live crowd sentiment, and returns a verdict: Unlikely / Skeptical / Plausible / Likely. Paste any influencer's "$X by EOY" tweet and find out whether the data agrees. We use the same divergence math we publish 35.5% accuracy on, so the verdict is honest in both directions — it'll also tell you when a prediction is plausible. Free tier: 5 checks/day. Pro / Max / Lifetime: unlimited.
Is there a free trial?
Yes — 7 days of Pro or Max, free, no credit card required. Start the trial inside the app from the Paywall screen. At the end of 7 days you decide: pay annually in USDT, monthly via your app store, or drop back to the free tier (which is real, useful, and stays free forever). No auto-charge, no "we'll bill you unless you cancel" trap.
Is this financial advice?
No. Cryptochartics is a crypto intelligence layer — we show you what twelve well-known technical indicators say about a coin, what the crowd is feeling, and when those two stories disagree. That's it. We don't tell you to buy, sell, or hold. We don't manage money. We don't promise results. Decisions are yours. Crypto is volatile — trade money you can afford to lose.
How accurate are your signals?
Across 3,767 evaluated trades, our engine's directional win rate is 35.5% — below the ~50% needed to be profitable at 1:1 R:R after Binance fees. We publish this openly inside the app on the "Engine Accuracy" tab, and in a full public audit at cryptochartics.com/blog/we-measured-ta-failure. The academic literature (Sullivan/Timmermann/White 1999, Wei 2024) says ~35% is roughly the expected outcome for any 12-indicator ensemble. We're not selling signals as a profit machine; we're selling honest divergence detection between TA and crowd sentiment.
What does "divergence" mean here?
A divergence is when the engine's 12-indicator technical consensus and the crowd's sentiment composite point in opposite directions, with a ≥35-point gap on a 0-100 bullish scale. Example: engine says BULLISH on ETH 4h, but crowd sentiment is 28% bullish. That's a strong divergence — we flag it on the Pulse tab and (if you've opted in) fire a push alert. We don't claim divergences predict price moves — we claim they're information worth pausing on for any decision you're already going to make.
If the engine is only 35% accurate, why use it at all?
Because the value isn't in the signals themselves — it's in the contrast between TA and crowd sentiment. We've found that neither layer is reliably predictive on its own (academic literature confirms this for TA; sentiment is the same), but the divergences between them are inherently interesting moments. You learn more about market psychology in a week of watching divergences resolve than in a year of "BUY" alerts. That's the educational value. Use it as research, not as instructions.
Is there an iOS version?
Yes — Cryptochartics is live on both the App Store and Google Play. The free tier is identical across platforms. Paid tiers (Pro / Max) are currently Android-only while we finalize the business banking required for Apple In-App Purchases; iOS users get the full free experience today, and we'll enable Pro / Max on iOS in a later update. Download on the App Store or Get it on Google Play.
Why annual prepaid in crypto, not credit cards?
Two reasons. One: no auto-renewal means no surprise charges six months from now — you opt in actively when the year ends. Two: stablecoin payments cut card-processing fees, which is why we can charge $30/year instead of $50. Monthly card subscriptions through the Play Store are also available if you prefer.
What data sources do you use?
Binance Spot for OHLCV candles. The 12 indicators (RSI, MACD, EMA cross, Stochastic, Bollinger, ATR, ADX, OBV, Ichimoku, CCI, Williams %R, Volume Profile) computed from those candles using pandas-ta. Crowd sentiment is pulled hourly from CoinGecko (community engagement, votes, exchange listings) and Wikipedia (pageview velocity / interest spikes), then composed into a single 0–100 bullish % per coin. Everything is stored on Supabase Postgres and published over Supabase Realtime — the app sees new readings within a second of computation.
Do you sell my data?
No. We don't sell, share, or barter user data. The app is paid for by Pro/Max subscriptions and stablecoin payments. Free accounts cost us a few cents a month to run, which is fine. The full code is open at github.com/muratchary/cryptochartics if you want to verify.
Where can I read the full audit?
The full audit lives at cryptochartics.com/blog/we-measured-ta-failure. ~15 min read, includes the methodology, every chart, the confidence-paradox finding, the Williams %R reverse-predictive finding, and the academic literature citations. You can also grab the PDF version via the form below. We've made the methodology reproducible — if you find an error, please tell us at hello@cryptochartics.com.
Free audit · 8 pages

What 3,767 crypto signals taught us about technical analysis.

The full audit: 35.5% win rate, the confidence-paradox table, the Williams %R reverse-predictive finding, the academic literature backing it up — and why we pivoted Cryptochartics to honest divergence detection instead of signals.

Written by the founder. Methodology included. Reproducible.

Read the audit online → · Download PDF directly ↓

We email you the PDF link and an occasional update — including new divergence findings as we publish them. Unsubscribe with one click. No spam, no resale.

Got it — the audit is on its way.
In the meantime, download the PDF now ↓ or read it online.

See the gap.
Decide for yourself.

Crowd sentiment + 12 technical indicators, side by side. Divergence alerts only when it matters. Engine accuracy published openly. Free to start, free forever. Cancel any time.